Getting Started
labicompare is a Python library designed for researchers and data scientists who need to perform rigorous statistical comparisons between multiple Machine Learning models.
Why labicompare?
When comparing models across multiple datasets, looking at mean accuracy is not enough. You need to know if the differences are statistically significant. labicompare automates:
- Friedman Tests to detect global differences.
- Wilcoxon-Holm Post-hoc Tests for pairwise comparisons.
- CD Diagrams for high-quality, publication-ready visualizations.
We also have another plots, like a difference_distribution plot, pvalue_matrix plot or one_vs_one plot. See the gallery or further documentation to see how you can use each one.
Installation
Install the library using pip:
pip install git+https://github.com/jose-gilberto/labicompare/
Note: this version is already in process to be published on pip :)
Basic Workflow
The library follows a simple three-step process:
- Wrap your data: Convert your results (Accuracy, Error, etc.) into an
EvaluationDataobject. - Test: Run an specific test to get a statistical summary object.
- Plot: Generate the plots that you want.
Example
import pandas as pd
from labicompare.core.data import EvaluationData
from labicompare.stats import evaluate_models
from labicompare.plots.ranking import plot_cd_diagram

# Your results: Rows = Datasets, Columns = Models
df = pd.read_csv("results.csv")
data = EvaluationData(df, higher_is_better=True)

# Run statistics
summary = wilcoxon_holm(data, alpha=0.05)

# Visualize as an CD-Diagram
fig = plot_cd_diagram(data, summary, highlight_models=['InceptionTime'])
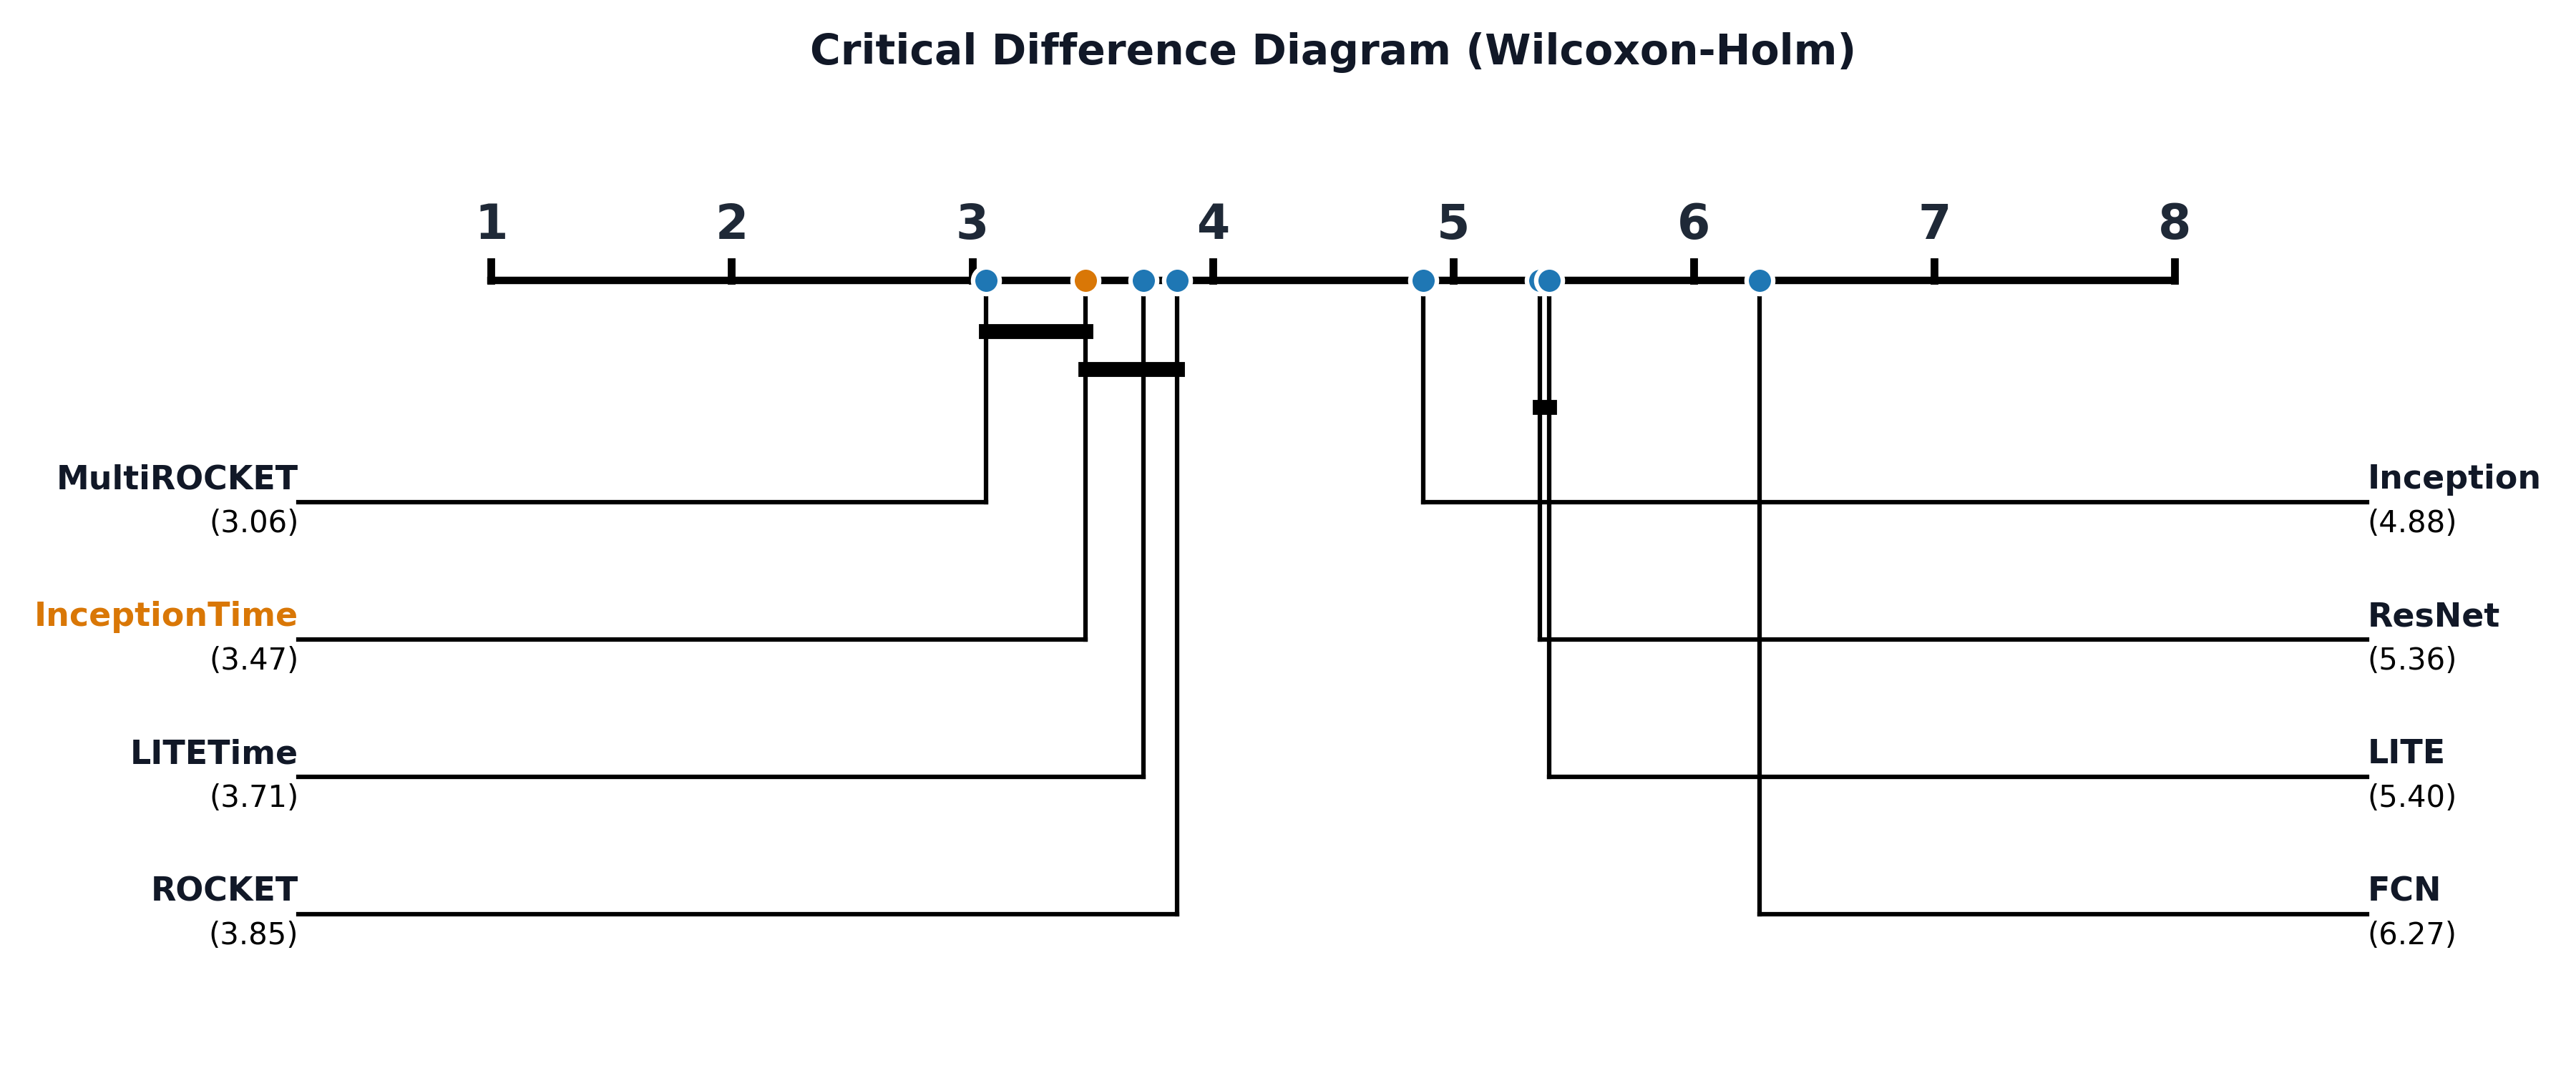
This code will produce something like this:
After that, you can manipulate the fig instance as you like. Maybe save as an PDF format for your paper :)